Malaysia Government Debt To GDP
Malaysia recorded a Government Debt to GDP of 52.60 percent of the country's Gross Domestic Product in 2011. Historically, from 1990 until 2011, Malaysia Government Debt To GDP averaged 47.3900 Percent reaching an all time high of 79.5000 Percent in December of 1990 and a record low of 31.8000 Percent in December of 1997. Generally, Government debt as a percent of GDP is used by investors to measure a country ability to make future payments on its debt, thus affecting the country borrowing costs and government bond yields. This page includes a chart with historical data for Malaysia Government Debt To GDP.
1997年最低,当时是华哥做财政部长。
很遗憾的是,过后不晓得为什么,财政部长都由首相兼顾。
从下图可以看得出,我们的首相一个比一个『英明神武』。
Malaysia GDP Annual Growth Rate
The Gross Domestic Product (GDP) in Malaysia expanded 4.70 percent in the first quarter of 2012 over the same quarter of the previous year. Historically, from 2000 until 2012, Malaysia GDP Annual Growth Rate averaged 4.5500 Percent reaching an all time high of 10.1000 Percent in March of 2010 and a record low of -6.2000 Percent in March of 2009. The annual growth rate in Gross Domestic Product measures the increase in value of the goods and services produced by an economy over the period of a year. Therefore, unlike the commonly used quarterly GDP growth rate the annual GDP growth rate takes into account a full year of economic activity, thus avoiding the need to make any type of seasonal adjustment. This page includes a chart with historical data for Malaysia GDP Annual Growth Rate.
下图是将时间点放长来看。
2009年次贷的伤害,的确不简单。
当时也是一个难得的入场机会,可惜我错过了。
前一个最佳入场点在2001年左右,网络泡沫吧。
Malaysia GDP Growth Rate
The Gross Domestic Product (GDP) in Malaysia contracted 3.20 percent in the first quarter of 2012 over the previous quarter. Historically, from 2000 until 2012, Malaysia GDP Growth Rate averaged 1.1800 Percent reaching an all time high of 5.9000 Percent in September of 2009 and a record low of -7.6000 Percent in March of 2009. The Gross Domestic Product (GDP) growth rate provides an aggregated measure of changes in value of the goods and services produced by an economy. Malaysia is a rapidly developing economy in Asia. Malaysia, a middle-income country, has transformed itself since the 1970s from a producer of raw materials into an emerging multi-sector economy. The Government of Malaysia is continuing efforts to boost domestic demand to wean the economy off of its dependence on exports. Nevertheless, exports - particularly of electronics - remain a significant driver of the economy. This page includes a chart with historical data for Malaysia GDP Growth Rate.
Malaysia Imports
Malaysia imports were worth 50.2 Billion MYR in April of 2012. Historically, from 1988 until 2012, Malaysia Imports averaged 25752.6100 Million MYR reaching an all time high of 52430.0000 Million MYR in December of 2011 and a record low of 5298.0000 Million MYR in February of 1990. Malaysia imports commodities: electronics, machinery, petroleum products, plastics, vehicles, iron and steel products and chemicals. Its main import partners are: Japan, China, European Union, Singapore and United States. This page includes a chart with historical data for Malaysia Imports.
逐年增加。
Malaysia Exports
Malaysia exports were worth 57.7 Billion MYR in April of 2012. Historically, from 1990 until 2012, Malaysia Exports averaged 30688.2500 Million MYR reaching an all time high of 64060.0000 Million MYR in March of 2011 and a record low of 5379.0000 Million MYR in February of 1990. International trade plays a large role in Malaysian economy. Malaysia's main exports constitute electrical and electronics products (more than 50% of total exports). It is also a big exporter of crude oil, liquefied natural gas, palm oil and natural rubber. Malaysia also sends abroad chemicals, machinery, appliances and manufactures metals. Main export partners are: United States, Singapore, European Union and Japan. This page includes a chart with historical data for Malaysia Exports.
还好,出口比进口多。
Malaysia Current Account to GDP
Malaysia reported a Current Account surplus of 11.50 percent of the country's Gross Domestic Product in 2011. Historically, from 1980 until 2011, Malaysia Current Account to GDP averaged 3.3500 Percent reaching an all time high of 17.5000 Percent in December of 2008 and a record low of -13.2000 Percent in December of 1982. The Current account balance as a percent of GDP provides an indication on the level of international competitiveness of a country.
Usually, countries recording a strong current account surplus have an economy heavily dependent on exports revenues, with high savings ratings but weak domestic demand.
On the other hand, countries recording a current account deficit have strong imports, a low saving rates and high personal consumption rates as a percentage of disposable incomes. This page includes a chart with historical data for Malaysia Current Account to GDP.
马来西亚以出口为导向,内销还是逊色。
综合上面两张图表后,可以得到这个结论。
Malaysia Business Confidence
In Malaysia, business confidence improved to 116.5 in the first quarter of 2012 from 96.6 in the fourth quarter of 2011. Historically, from 1998 until 2012, Malaysia Business Confidence averaged 105.5800 reaching an all time high of 126.0000 in September of 2000 and a record low of 70.6000 in June of 2008. In Malaysia, Malaysian Institute of Economic Research Business Conditions Survey covers a sample of over 350 manufacturing businesses incorporated locally and foreign manufacturing concerns operating in Malaysia, covering 11 industries. Questions posed in the survey questionnaire are on key determinants such as production level, new order bookings, sales performances, inventory build-up and new job openings. This page includes a chart with historical data for Malaysia Business Confidence.
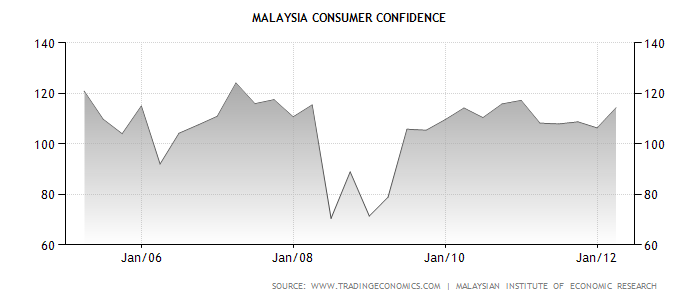
Malaysia Consumer Confidence
In Malaysia, consumer confidence improved to 114.3 in the first quarter of 2012 from 106.3 in the fourth quarter of 2011. Historically, from 2005 until 2012, Malaysia Consumer Confidence averaged 106.2600 reaching an all time high of 124.1000 in March of 2007 and a record low of 70.5000 in June of 2008. In Malaysia, the Malaysian Institute of Economic Research The Survey of Consumer Sentiments is a series of surveys conducted quarterly on a sample of over 1200 households in Malaysia to gauge consumer spending trends and sentiments. Repondents are asked about perceptions on their household's current and expected financial positions and their employment outlook. The survey also seeks to uncover general economic conditions such as inflation as seen from the consumers' perspective. Questions relating to their plans to buy houses, new or used cars and other major consumer durable are also asked. This page includes a chart with historical data for Malaysia Consumer Confidence.

Malaysia GDP per capita
The Gross Domestic Product per capita in Malaysia was last reported at 5184.71 US dollars in 2010, according to a report published by the World Bank. The GDP per Capita in Malaysia is equivalent to 42 percent of the world's average. Historically, from 1960 until 2010, Malaysia GDP per capita averaged 2539.9400 USD reaching an all time high of 5184.7100 USD in December of 2010 and a record low of 814.5800 USD in December of 1960. The GDP per capita is obtained by dividing the country’s gross domestic product, adjusted by inflation, by the total population. This page includes a chart with historical data for Malaysia GDP per capita.
Malaysia Interest Rate
The benchmark interest rate in Malaysia was last reported at 3.00 percent. Historically, from 2004 until 2012, Malaysia Interest Rate averaged 2.9100 Percent reaching an all time high of 3.5000 Percent in April of 2006 and a record low of 2.0000 Percent in February of 2009. In Malaysia, the interest rate decisions are taken by The Central Bank of Malaysia (Bank Negara Malaysia). The official interest rate is the overnight rate. This page includes a chart with historical data for Malaysia Interest Rate.
Malaysia Inflation Rate
The inflation rate in Malaysia was recorded at 1.7 percent in May of 2012. Historically, from 2005 until 2012, Malaysia Inflation Rate averaged 2.8 Percent reaching an all time high of 8.5 Percent in July of 2008 and a record low of -2.4 Percent in July of 2009. Inflation rate refers to a general rise in prices measured against a standard level of purchasing power. The most well known measures of Inflation are the CPI which measures consumer prices, and the GDP deflator, which measures inflation in the whole of the domestic economy. This page includes a chart with historical data for Malaysia Inflation Rate.
Malaysia Government Bond 10Y
Malaysia's Government Bond Yield for 10 Year Notes declined 3 basis points during the last 30 days which means it became less expensive for Malaysia to borrow money from investors. During the last 12 months, Malaysia government bond yield declining 0.40 percent. Historically, from 2005 until 2012, Malaysia Government Bond 10Y averaged 4.0 Percent reaching an all time high of 5.1 Percent in June of 2006 and a record low of 3.0 Percent in January of 2009. Generally, a government bond is issued by a national government and is denominated in the country`s own currency. Bonds issued by national governments in foreign currencies are normally referred to as sovereign bonds. The yield required by investors to loan funds to governments reflects inflation expectations and the likelihood that the debt will be repaid. This page includes a chart with historical data for Malaysia Government Bond 10Y.
Malaysia Government Budget
Malaysia reported a Government Budget deficit equal to 5.30 percent of the country's Gross Domestic Product in 2011. Historically, from 1988 until 2011, Malaysia Government Budget averaged -2.8900 Percent of GDP reaching an all time high of 2.4000 Percent of GDP in December of 1997 and a record low of -7.4000 Percent of GDP in December of 2009. Government Budget is an itemized accounting of the payments received by government (taxes and other fees) and the payments made by government (purchases and transfer payments). A budget deficit occurs when an government spends more money than it takes in. The opposite of a budget deficit is a budget surplus. This page includes a chart with historical data for Malaysia Government Budget.
没有办法,又要赞一赞华哥了。
自从我国开始实行首相兼职财政部长后,每况愈下。
Malaysia Industrial Production
Industrial Production in Malaysia increased 3.2 percent in April of 2012. Historically, from 2007 until 2012, Malaysia Industrial Production averaged 1.0 Percent reaching an all time high of 14.2 Percent in March of 2010 and a record low of -18.0 Percent in January of 2009. Industrial production measures changes in output for the industrial sector of the economy which includes manufacturing, mining, and utilities. Industrial Production is an important indicator for economic forecasting and is often used to measure inflation pressures as high levels of industrial production can lead to sudden changes in prices. This page includes a chart with historical data for Malaysia Industrial Production.
Malaysia Population
Historically, from 1960 until 2010, Malaysia Population averaged 16.8000 Million reaching an all time high of 28.5000 Million in December of 2010 and a record low of 8.1400 Million in December of 1960. The total population in Malaysia was last reported at 28.5 million people in 2010 from 8.1 million in 1960, changing 250 percent during the last 50 years. Malaysia has 0.41 percent of the world´s total population which means that one person in every 242 people on the planet is a resident of Malaysia. This page includes a chart with historical data for Malaysia's Total Population. This page includes a chart with historical data for Malaysia Population.
Malaysia Unemployment Rate
The unemployment rate in Malaysia was last reported at 3 percent in April of 2012. Historically, from 1998 until 2012, Malaysia Unemployment Rate averaged 3.4 Percent reaching an all time high of 4.5 Percent in March of 1999 and a record low of 2.9 Percent in March of 1998. The unemployment rate can be defined as the number of people actively looking for a job as a percentage of the labour force. This page includes a chart with historical data for Malaysia Unemployment Rate.
Malaysia Stock Market
Stocks in Malaysia had a positive performance during the last month. The KLCI, a major stock market index based in Malaysia, rallied 47 points or 2.93 percent during the last 30 days. Historically, from 1977 until 2012, the KLCI averaged 690.2 reaching an all time high of 1606.6 in April of 2012 and a record low of 89.0 in April of 1977. The KLCI is a major stock market index which tracks the performance of large companies based in Malaysia. A stock market or exchange is the centre of a network of transactions where securities buyers meet sellers at a certain price. This page includes a chart with historical data for Malaysia Stock Market.
马来西亚整体的状况大致如上述图表所反映。
看上去,虽然有点瑕疵,可是还不错啦。万一换了新政府,也许会更糟糕也说不定。
不过,如果换了政府后会更好,又何乐而不为呢?